
By Dennis Pedri
A major part of the venture capital business is identifying innovative, transformative technologies before they become widely hyped — when valuations are still reasonable, before competitors catch on. Life sciences investors naturally track academic and clinical research closely, looking for signals that may translate into high-impact innovations down the line. To support these efforts, we have developed a tool at V-Bio Ventures which we call the ‘MeSH Counter’ — a way to easily visualize what is trending, stable, or fading in the life sciences.
The Medical Subject Headings (MeSH) is the U.S. National Library of Medicine’s method for indexing and organizing biomedical literature in the PubMed database. In practical terms, MeSH terms function as standardized, curated tags assigned to each article. They map synonyms and variant phrasing to a single underlying concept and are organized in a hierarchical tree, from broad categories to increasingly specific topics. This structure makes it possible to expand searches to include related subtopics, or narrow them to a precise niche.
Because MeSH is curated and standardized, it provides a naturally suitable substrate for trend detection. A quick way to spot emerging themes is to review the new MeSH descriptors introduced each year. While the 2025 list is still being finalized, the 311 new descriptors added in 2024 are publicly listed by the National Library of Medicine (NLM). Several of these additions — such as Micropeptides, Enhancer RNAs, and Metabolic Reprogramming — reflect areas of basic biology that have recently gained prominence.
At V-Bio, we wanted a more granular, quantitative view of what is gaining (or losing) attention in academic literature. That is why we built the MeSH Counter.
In short, it is an R-based tool that counts MeSH term occurrences per month and normalizes them to the total number of PubMed publications over the same period. PubMed added more than nine million publications in the last five years, so at first glance this may seem like a daunting task. Fortunately, the National Center for Biotechnology Information (NCBI) provides programmatic access to PubMed via the Entrez Programming Utilities (E‑utilities) API, which we leveraged for our automated data collection.
For our initial implementation, we extracted MeSH terms from the following top-level categories: Anatomy, Organisms, Diseases, Chemicals and Drugs, Analytical, Diagnostic and Therapeutic Techniques and Equipment, Psychiatry and Psychology, Phenomena and Processes, Disciplines and Occupations, Technology, Industry and Agriculture, Information Science, Health Care. We ended up with a total of 36,724 individual terms.
Once we had collected the monthly occurrence for each of these MeSH terms, the next challenge was ranking ‘what’s trending?’.
To do this, we used a simple approach. For each term, we fit trend lines across two fixed time spans: a five-year period (giving us its long-term trajectory) and the most recent 12-month period within that time (for its near-term acceleration).
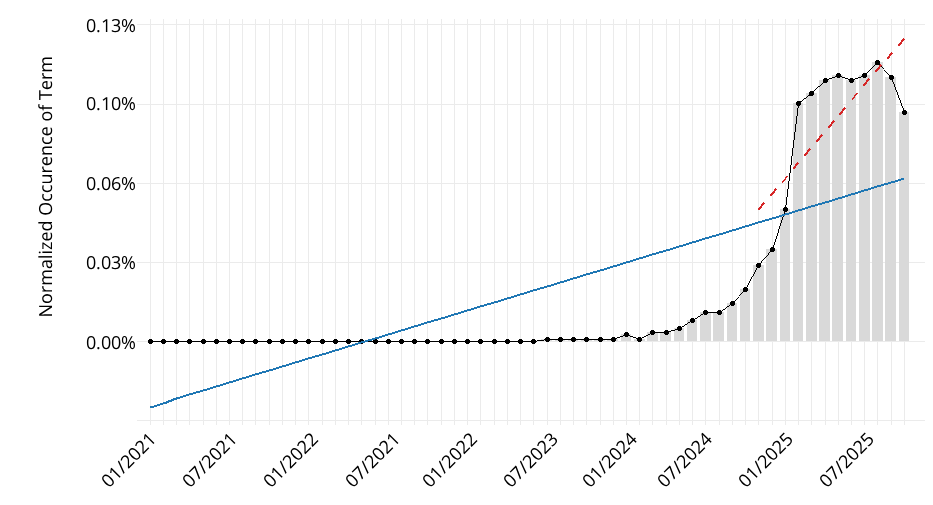
Figure 1: Normalized monthly occurrence of the term ‘Generative Artificial Intelligence’ in PubMed from 2021 to 2025, with trend lines for the total 5-year duration (blue) and last 12 months (red).
From these figures, we computed three metrics for each MeSH term:
Each metric captures a different measure of a term’s growth: slope emphasizes its average trajectory, delta emphasizes the magnitude of change, and momentum emphasizes its recent acceleration.
To make the outputs easier to interpret, we created heatmaps that plot the normalized occurrence of the selected terms over time. For example, the 200 terms which showed the strongest increase in usage in PubMed over a five-year period.
In these heatmaps, each term’s row is scaled to its own minimum and maximum. This ensures every term spans the full color range, making patterns comparable across terms and highlighting within-term dynamics over time, rather than differences in absolute prevalence across terms.
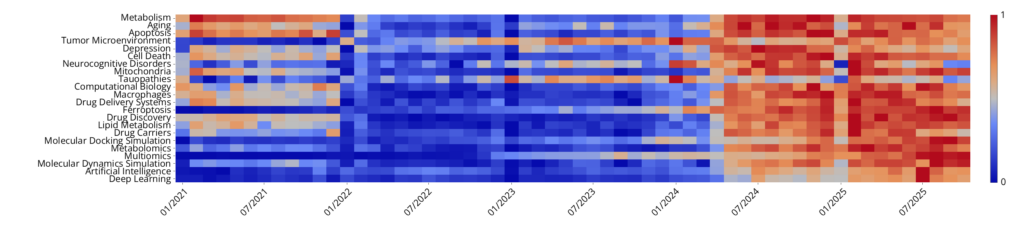
Figure 2: Heatmap of a selection of terms from the 200 MeSH terms with the strongest five-year growth (by normalized monthly occurrence in PubMed from 2021 to 2025).
To navigate the complex world of early-stage biotech, investors have to do more than analyze financials and clinical milestones — they must reckon with their own biases and cultural tendencies.
Understanding the psychological divide between US and European investors isn’t just a curiosity — it’s a strategic asset. Those who learn to blend the bravery of American venture capital with the wisdom of European finance will not only build stronger portfolios — they’ll also be better positioned to fund future health solutions, to everyone’s benefit.
We also looked at the inverse: which terms have been declining most in usage over the same five-year period.
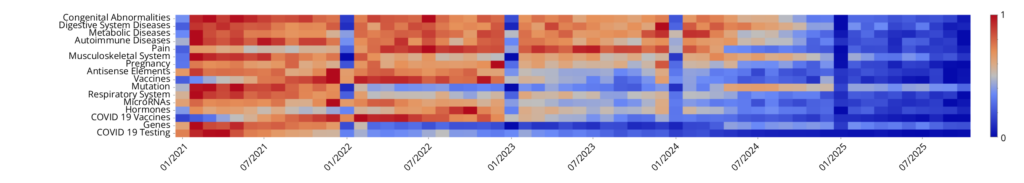
Figure 3: Heatmap of a selection of terms from the 200 MeSH terms with the strongest five-year decline (by normalized monthly occurrence in PubMed from 2021 to 2025).
Finally, we visualized momentum — each term’s relative change in prevalence from one month to the next — to highlight topics that may be gaining traction in the most recent literature.
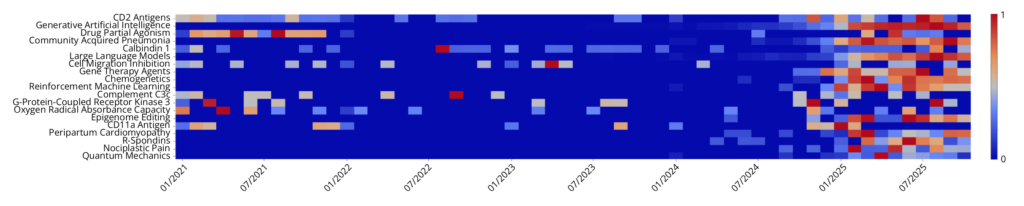
Figure 4: Heatmap of a selection of terms from the 200 MeSH terms with the highest momentum (by the difference to the previous month in normalized monthly occurrence in PubMed from 2021 to 2025).
A few key learnings about our MeSH Counter methods have already emerged from our analysis.
The MeSH Counter is most powerful if the exercise is repeated every few months, comparing the results from different points in time for more insights and conclusions. However, when using the tool, it is important to bear in mind that some terms move in waves, with sharp spikes and declines over short periods. This is to be expected: researchers respond to pivotal papers, and ‘follow-on’ work often created publications clustered in time. Biases might also be introduced by events like major conferences or special journal issues focusing on specific fields.
This effect was evident when we compared our latest results to a MeSH analysis we conducted three months earlier. In that comparison, the top 200 terms were highly stable, with 89% overlap between the two five-year periods. By contrast, there was far more variability between the most recent 12-month periods (about 20% overlap), and between the momentum rankings. For example, while some terms were present in both analyses (e.g.) Artificial Intelligence, GLP1, Molecular Docking Simulation, High Throughput Screening Assays, and Ferroptosis, other terms were present in the first but were gone from the top 200 terms list just three months later (e.g. Alzheimer’s Disease, Tauopathies, Mood disorders, and Sleep Disorders).
The MeSH Counter has at least two important limitations.
Firstly, there is an indexing lag: MeSH terms are assigned after publication – usually a month or two — so the tool should not be used to interpret trends in the most recent months.
Secondly, publications are not endorsements for investment: an increase in the prevalence of a term or topic does not necessarily imply that there is an investment opportunity or long-term value in the field. Research activity can be driven by many factors, including funding cycles, methodological fads, disease outbreaks, or other transient forces.
As with most tools, the MeSH Counter is useless if not guided by human intelligence. However, when used appropriately, it can efficiently map how the biomedical research landscape is shifting. At V-Bio Ventures, we see it as a tool that strengthens our ongoing scouting efforts for transformative health innovations, by helping us ask better questions and spot patterns earlier.
For investors, the MeSH Counter can provide a complimentary addition to the insights we only glean from deep domain expertise, and the essential human relationships we build with peers, entrepreneurs, and researchers.